Note
Go to the end to download the full example code
Model Validation#
This script will show how to use the model validation methods in CCA-Zoo including permutation testing, learning curves, and cross-validation.
# Import libraries
import numpy as np
import matplotlib.pyplot as plt
from sklearn.model_selection import ShuffleSplit, KFold
from cca_zoo.datasets import JointData
from cca_zoo.linear import CCA
from cca_zoo.model_selection import learning_curve, permutation_test_score
np.random.seed(42) # We set the random seed for reproducibility
n = 250 # number of samples
p = 15 # features in view 1
q = 15 # features in view 2
latent_dimensions = 1 # latent dimensions
correlations = [0.9] # correlations between representations
def plot_learning_curve(
estimator,
title,
views,
axes=None,
ylim=None,
cv=None,
n_jobs=None,
train_sizes=np.linspace(0.1, 1.0, 5),
):
"""
Generate 3 plots: the test and training learning curve, the training
samples vs fit times curve, the fit times vs score curve.
Parameters
----------
estimator : estimator instance
An estimator instance implementing `fit` and `predict` methods which
will be cloned for each validation.
title : str
Title for the chart.
views : array-like of shape (n_samples, n_features)
Training vector, where ``n_samples`` is the number of samples and
``n_features`` is the number of features.
y : array-like of shape (n_samples) or (n_samples, n_features)
Target relative to ``representations`` for classification or regression;
None for unsupervised learning.
axes : array-like of shape (3,), default=None
Axes to use for visualisation the curves.
ylim : tuple of shape (2,), default=None
Defines minimum and maximum y-values plotted, e.g. (ymin, ymax).
cv : int, cross-validation generator or an iterable, default=None
Determines the cross-validation splitting strategy.
Possible inputs for cv are:
- None, to use the default 5-fold cross-validation,
- integer, to specify the number of folds.
- :term:`CV splitter`,
- An iterable yielding (train, test) splits as arrays of indices.
For integer/None inputs, if ``y`` is binary or multiclass,
:class:`StratifiedKFold` used. If the estimator is not a classifier
or if ``y`` is neither binary nor multiclass, :class:`KFold` is used.
Refer :ref:`User Guide <cross_validation>` for the various
cross-validators that can be used here.
n_jobs : int or None, default=None
Number of jobs to run in parallel.
``None`` means 1 unless in a :obj:`joblib.parallel_backend` context.
``-1`` means using all processors. See :term:`Glossary <n_jobs>`
for more details.
train_sizes : array-like of shape (n_ticks,)
Relative or absolute numbers of training examples that will be used to
generate the learning curve. If the ``dtype`` is float, it is regarded
as a fraction of the maximum size of the training set (that is
determined by the selected validation method), i.e. it has to be within
(0, 1]. Otherwise it is interpreted as absolute sizes of the training
sets. Note that for classification the number of samples usually have
to be big enough to contain at least one sample from each class.
(default: np.linspace(0.1, 1.0, 5))
"""
if axes is None:
_, axes = plt.subplots(1, 3, figsize=(20, 5))
axes[0].set_title(title)
if ylim is not None:
axes[0].set_ylim(*ylim)
axes[0].set_xlabel("Training examples")
axes[0].set_ylabel("Score")
train_sizes, train_scores, test_scores, fit_times, _ = learning_curve(
estimator,
views,
cv=cv,
n_jobs=n_jobs,
train_sizes=train_sizes,
return_times=True,
)
train_scores_mean = np.mean(train_scores, axis=1)
train_scores_std = np.std(train_scores, axis=1)
test_scores_mean = np.mean(test_scores, axis=1)
test_scores_std = np.std(test_scores, axis=1)
fit_times_mean = np.mean(fit_times, axis=1)
fit_times_std = np.std(fit_times, axis=1)
# Plot learning curve
axes[0].grid()
axes[0].fill_between(
train_sizes,
train_scores_mean - train_scores_std,
train_scores_mean + train_scores_std,
alpha=0.1,
color="r",
)
axes[0].fill_between(
train_sizes,
test_scores_mean - test_scores_std,
test_scores_mean + test_scores_std,
alpha=0.1,
color="g",
)
axes[0].plot(
train_sizes, train_scores_mean, "o-", color="r", label="Training score"
)
axes[0].plot(
train_sizes, test_scores_mean, "o-", color="g", label="Cross-validation score"
)
axes[0].legend(loc="best")
# Plot n_samples vs fit_times
axes[1].grid()
axes[1].plot(train_sizes, fit_times_mean, "o-")
axes[1].fill_between(
train_sizes,
fit_times_mean - fit_times_std,
fit_times_mean + fit_times_std,
alpha=0.1,
)
axes[1].set_xlabel("Training examples")
axes[1].set_ylabel("fit_times")
axes[1].set_title("Scalability of the model")
# Plot fit_time vs score
fit_time_argsort = fit_times_mean.argsort()
fit_time_sorted = fit_times_mean[fit_time_argsort]
test_scores_mean_sorted = test_scores_mean[fit_time_argsort]
test_scores_std_sorted = test_scores_std[fit_time_argsort]
axes[2].grid()
axes[2].plot(fit_time_sorted, test_scores_mean_sorted, "o-")
axes[2].fill_between(
fit_time_sorted,
test_scores_mean_sorted - test_scores_std_sorted,
test_scores_mean_sorted + test_scores_std_sorted,
alpha=0.1,
)
axes[2].set_xlabel("fit_times")
axes[2].set_ylabel("Score")
axes[2].set_title("Performance of the model")
return plt
# Data generation
(X, Y) = JointData(
view_features=[p, q], latent_dimensions=latent_dimensions, correlation=correlations
).sample(n)
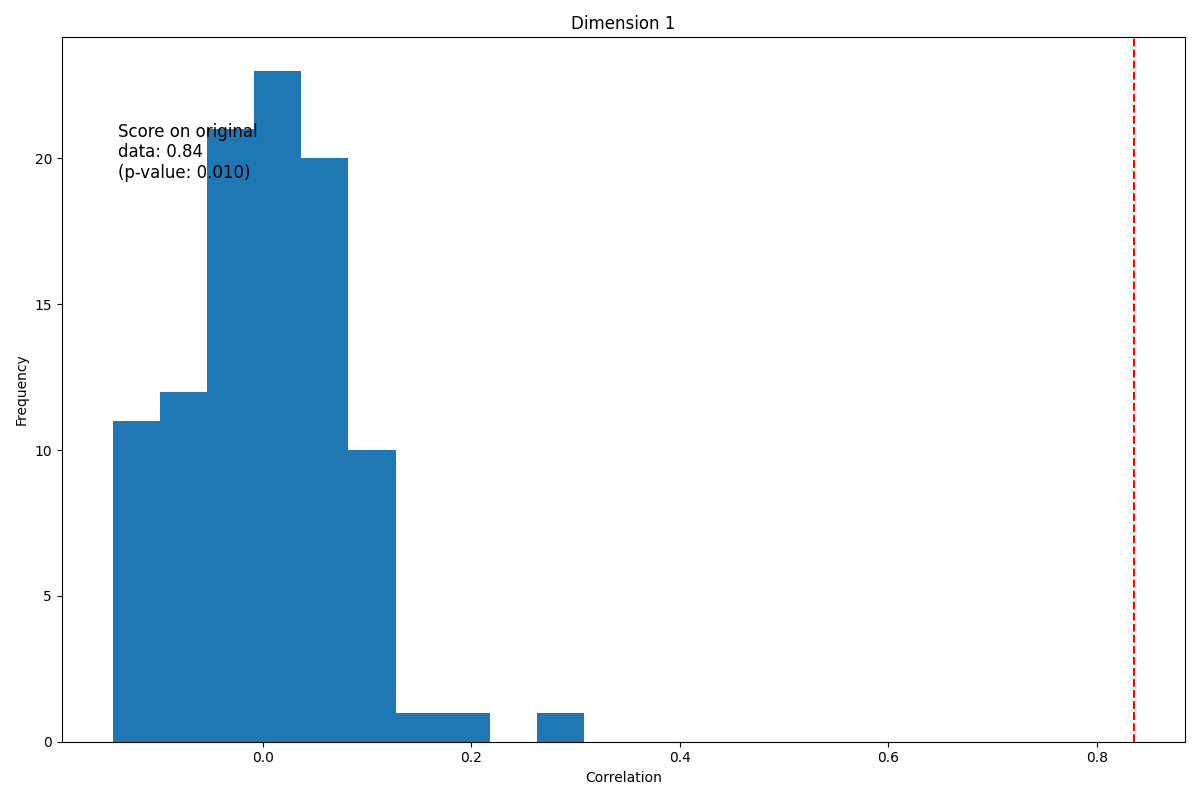
# Permutation Testing
model = CCA(latent_dimensions=latent_dimensions)
cv = KFold(2, shuffle=True, random_state=0)
score, perm_scores, pvalue = permutation_test_score(
model, (X, Y), cv=cv, n_permutations=100
)
# Permutation Test Visualization
fig, ax = plt.subplots(latent_dimensions, figsize=[12, 8])
for k in range(latent_dimensions):
ax.hist(perm_scores)
ax.axvline(score, ls="--", color="r")
score_label = f"Score on original\ndata: {score:.2f}\n(p-value: {pvalue:.3f})"
ax.text(0.05, 0.8, score_label, fontsize=12, transform=ax.transAxes)
ax.set_xlabel("Correlation")
_ = ax.set_ylabel("Frequency")
ax.set_title(f"Dimension {k + 1}")
plt.tight_layout()
plt.show()
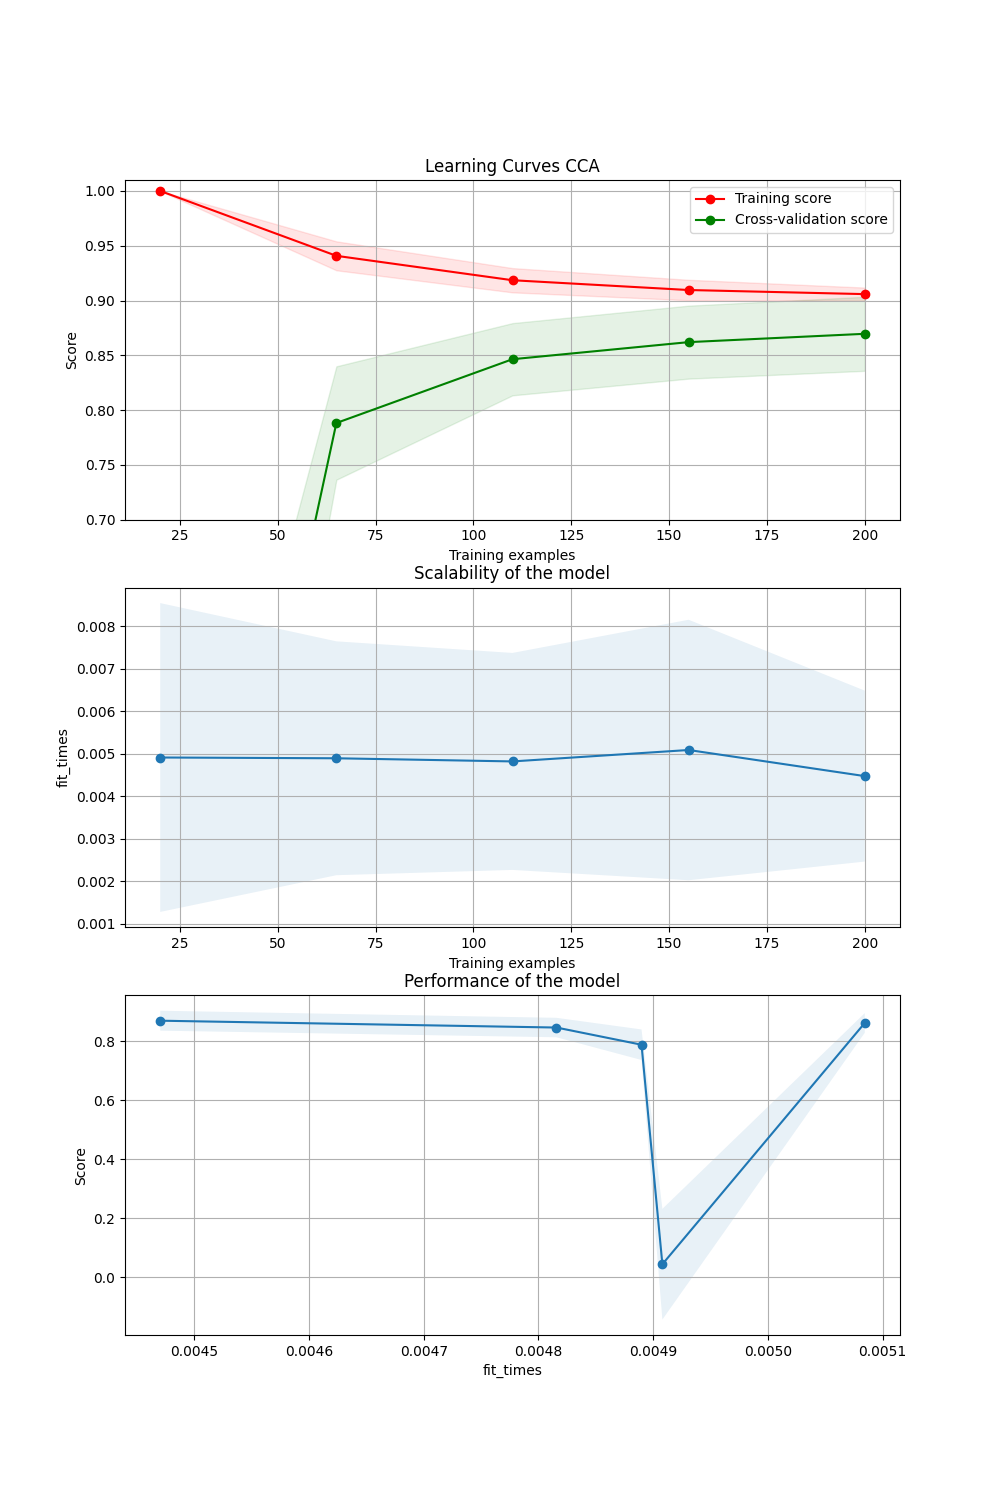
# Learning Curves
fig, axes = plt.subplots(3, 1, figsize=(10, 15))
title = "Learning Curves CCA"
cv = ShuffleSplit(n_splits=50, test_size=0.2, random_state=0)
model = CCA()
plot_learning_curve(model, title, (X, Y), axes=axes, ylim=(0.7, 1.01), cv=cv, n_jobs=4)
plt.show()
Total running time of the script: (0 minutes 5.165 seconds)